Importance of Thermal Analysis in PCB Life Prediction

Electronic devices are built on a printed circuit board (PCB), which serves as the foundation that provides the power supply and allows communication between the different devices. Reliability of the PCB is critical to ensure that these electronic devices remain connected, avoiding malfunctions and ensuring the device performs its intended functions for extended periods of time. There are a variety of failure modes that can affect the reliability of a PCB that are discussed in a webinar that DRD Technology conducted, but the subject of this paper is specific to failure due to thermal cycling.

During operation a PCB can undergo a process known as thermal cycling, which is referred to as the repeated exposure of a PCB to fluctuations in temperature during its operational lifecycle. The fluctuations in temperature can be caused by normal operation of the PCB or changes in the environment it is exposed to. These variations in temperature over time can have a profound impact on the solder joints and significantly reduce the life span of the PCB.

As a PCB heats up and cools down through a process known as thermal cycling, there is a phenomenon known as thermal expansion mismatch due to the different materials that make up the board and its components. This cyclic loading causes mechanical strain that may eventually cause the solder joints to gradually deteriorate by causing fractures, cracks, and ultimately failure. These failures or malfunctions may result in erratic electrical connections, degenerate signal quality, or total device malfunctions, all of which can have serious repercussions by reducing the lifespan of the product.

There is a tool within the Ansys portfolio of products called Sherlock that provides fast and accurate life predictions for a PCB early in the design process. Sherlock enables engineers to break free from the design-build-break-repeat cycle that is common in the industry by empowering designers to quickly evaluate the probability of failure due to mechanical, and yes, thermal stress. Sherlock can also be used as a preprocessor for thermal analysis by identifying board level components and assigning material properties appropriately, which can save the designer a significant amount of time.

ECAD Preprocessing in Sherlock

Ansys Sherlock can read all major ECAD formats and can be used as a preprocessor for FEA and CFD analysis to save a significant amount of time. There is an extensive library of parts (over 600,000) and materials within Sherlock that can be used to automatically create geometry and assign material properties, which can reduce preprocessing times an order of magnitude – days to minutes. Sherlock will track over all the details in the ECAD and automatically extract part information from the CAD files, parts list, BOM, etc. See below parts list in Sherlock after reading in ECAD:

Sherlock references a collection of internal databases when assigning material and properties to board components. This streamlined feature can save the analyst a significant amount of time, but it is important to review the part properties and correct them as needed to ensure accurate results. Once the material and properties have been checked for accuracy, the project can be exported into the Ansys Electronics Desktop (AEDT) environment for thermal analysis.

Thermal Analysis in Icepak

It is important to provide Sherlock with accurate board and component level temperatures when predicting the board service life. Without simulation, the analyst would need to rely on experimental data which can be time consuming to produce because it requires a PCB to be manufactured and an experimental procedure developed to mimic conditions in the field. Incorporating thermal analysis early in the design process can provide accurate temperatures for life predictions without which can accelerate product development and reduce costly mistakes that require redesign.

An analyst can read in the exported project from Sherlock and all the materials and associated properties will automatically be assigned. A board can have a great number of components, so using Sherlock as a preprocessor can save the analyst a significant amount of time. See below temperature and velocity field from a thermal analysis solved in Icepak for a board experiencing forced convection cooling:
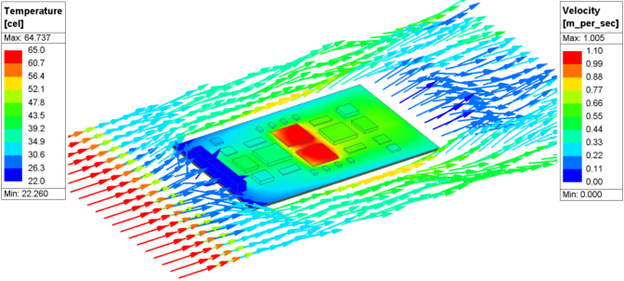
The temperature values on the board from the thermal analysis can be exported into a temperature map file that can be read into Sherlock for accurate thermal cycling. Accurate temperatures are important when predicting the probability of failure due to thermal cycling in solder fatigue analysis.

PCB Life Prediction in Sherlock

Bringing in accurate temperature values and distribution into Sherlock is critical when making life predictions. Sherlock can import images from heat maps found experimentally or temperature map files from thermal simulations. The benefit of using a temperature map file from thermal analysis is that the board does not even need to be manufactured. The analyst simply needs to read the results from Icepak into Sherlock to map the temperatures onto the board for accurate thermal cycling analysis. See below an image of the results from the thermal analysis in the previous section getting mapped onto the board in Sherlock:
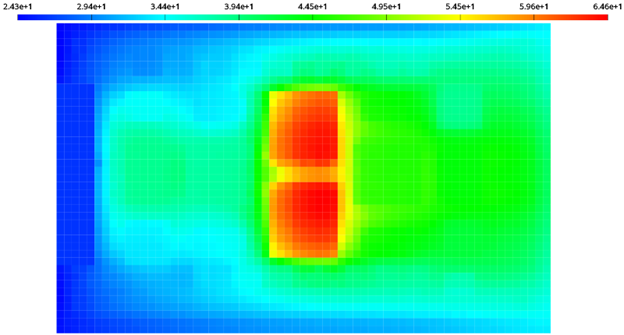
If the thermal cycle of the board is such that it simply powers on and off, then only a single temperature map from Icepak may be required if you can assume the off-power state reaches ambient conditions – the analyst only needs a temperature map file that represents the on-power state. There are various scenarios that would require multiple temperature map files to be read into Sherlock for thermal cycling analysis. For example, if the board has high and low-power states, the analyst will want to create a temperature map file for each state of the board to read into Sherlock for thermal cycling. The user can easily specify a maximum and minimum temperature state for the thermal cycle to account for the low and high-power state of the board, as well as ramp and dwell times.

Once the maximum and minimum temperature of the thermal cycle has been defined, a sold fatigue study can be conducted to predict the life of the board. See below:
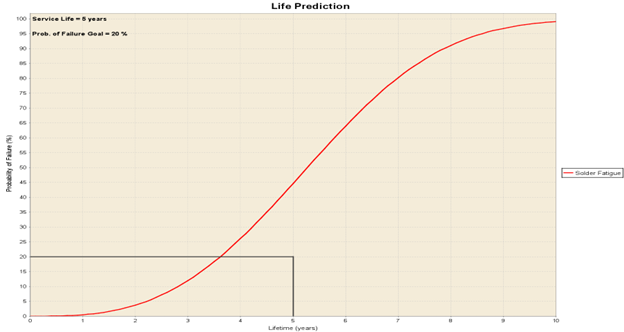
Reviewing the life prediction graph above indicates that there is a 45 percent change of failure due to thermal cycling. Catching issues like this early in the design process is critical in bringing products to market on time and budget.

Conclusion

Thermal cycling poses a significant risk to the reliability of solder joints in PCB design. The use of virtual prototyping early in the design process allows for a good understanding of the temperature load the PCB will be subjected to in the field, which leads to accurate solder fatigue analysis before the need to manufacture the board and gather experimental data. Integrating simulation into the design process enables engineers to ensure the long-term performance and reliability of electrical devices by identifying thermal issues early. Identifying and resolving the effect of temperature cycling on solder fatigue is essential to producing products that meet or surpass today’s needs in a world where electronics reliability is non-negotiable.

Thermal Management Solutions for Electronics

Thermal management of electronics is essential to a product’s dependability, efficiency, and lifespan.  Incorporating thermal analysis early in the design process is not just best practice, but necessary for engineers to deliver high-quality products in the ever-changing landscape of electronics design. Modern electronics are increasingly more complex and compact, and using engineering simulation allows engineers to test their design under real-word conditions in a virtual space to reduce physical testing and redesign.

Overheating can lead to performance degradation, accelerated aging, or catastrophic failures. Identifying excessive heat buildup early in the design process can reduce costs and accelerate product development by helping engineers identify hot spots so they can implement effective cooling strategies. Through thermal analysis, engineers can also understand the thermal interaction between components in an electronics enclosure and adjust the spatial arrangement to ensure long-term reliability and mitigate design risks which will streamline the design process.

Electro-Thermal Analysis of PCB

The modern PCB often contains complex circuitry with numerous components that must fit into a small space. The PCB design process must accommodate for this complexity while balancing the signal integrity, power distribution, thermal management, and manufacturability of the design. Ansys has several electronics and thermal simulation tools that are often used in concert to make informed decisions and mitigate risk for PCB design. DRD Technology has also published a webinar on some of these workflows on their website.

In Ansys Electronics Desktop (AEDT), a DCIR analysis is a valuable tool for PCB design that enables informed decision making around the application requirements. It is often used to understand voltage drops that can affect the performance of active components, identify regions of high current density that can cause hot spots, optimize the placement and thickness of traces, and other design issues. Detecting these early in the design process saves time and money associated with physical prototyping and testing. The losses measured in the DCIR analysis can be mapped onto the board for thermal analysis. These board losses can have a significant impact on the temperature field in electronics devices. In the simple electronic system below, the thermal model on the left does not have losses from the board incorporated, whereas the thermal model on the right does:

In the example above, incorporating the board losses into the thermal model provides a more accurate representation of the temperature field so an engineer can make informed decisions around cooling strategies. There is a rule of thumb often used when designing electronics with electrolytic capacitors, and that is for every increase in 10 degrees centigrade, the life of the capacitor is cut in half. This can make it crucial to include board losses in your thermal solution to provide detailed insight into how long the design will last.

Electro-Thermal Analysis of Waveguide Filter

For both military and commercial applications, waveguide filters are essential to modern radar and satellite communications. Waveguide filters with the ability to operate in a variety of challenging conditions and high-power loads are in greater demand. To better understand heat generation, distribution, and dissipation inside the waveguide structure, thermal simulation must be incorporated early in the design process.

By simulating the thermal conditions a wave guide filter will be subjected in a virtual environment, engineers can identify thermal related issues early in the design phase, implement effective cooling strategies and ensure appropriate materials are incorporated. Excessive heat buildup can cause mechanical deformation due to thermal stresses that can affect the filter’s performance and cause material degradation. Through virtual prototyping, the thermal characteristics of the wave guide filter under real world conditions can be simulated, and engineers can maintain acceptable temperature ranges which will ensure long term performance of the filter.  

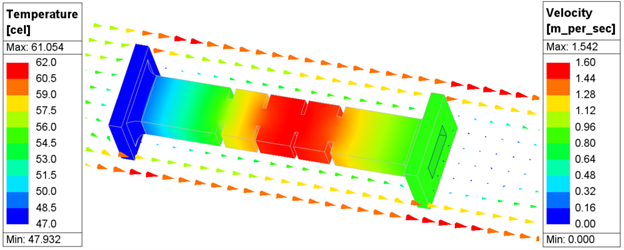
The electromagnetic and thermal performance of a wave guide filter can be evaluated within AEDT. Once an engineer has evaluated the electromagnetic performance of their design, the electrical losses can be converted into a thermal solution under real-word conditions. Below is an image of a thermal model that represents the waveguide filter subjected to force convection cooling to get an understanding of the temperature distribution.

This temperature field can then be converted into thermal stress and to get an idea of how the structural will deform in the field. Studying the thermal effects of the waveguide helps engineers identify areas of high thermal stress and design the filter that ensures long-term durability and reliability.

Electro-Thermal Analysis of Electric Motor

Electric motors are found throughout modern society, powering everything from household appliances to industrial machinery. They are responsible for 38.4% of the U.S. electrical energy consumption based on published information from the U.S. Department of Energy, which drives demand for new energy efficient designs. Managing the thermal aspects of these new energy efficient electric motors is often one of the most challenging aspects of the design process, and incorporating simulation early in the design process will help ensure these motors meet the high-performance requirements of modern applications.

What makes thermal management essential in electric motor design is the impact temperature can have on reliability and performance. Excessive heat can build up and degrade insulation, cause premature bearing wear, and cause demagnetization, all of which will reduce the efficiency and lifespan of the electric motor.  Thermal analysis will enable engineers to explore various cooling techniques and configurations in a virtual environment to quickly improve thermal management systems and bring products to market faster.

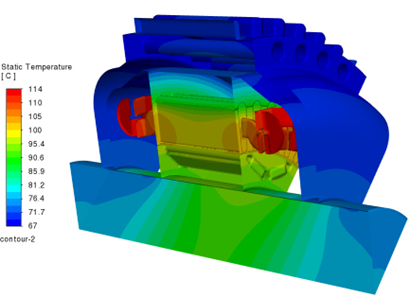
Ansys has electrical and thermal solutions for electrical motors. An engineer can evaluate the performance of their design withing AEDT, and once the performance of the electric motor has been evaluated and deemed appropriate for the application, the losses can be converted into a thermal solution. The stator of an electric motor is often where most of the heat is generated, and these losses can accurately be accounted for. In the image below the losses in the stator are mapped over into a tool called Ansys Fluent.

Conclusion

Thermal analysis is a fundamental component of electronics design that enables engineers to maximize efficiency, reliability, and performance by providing insight into the thermal behavior of the electrical system. By incorporating thermal analysis early in the design process, engineers can proactively handle thermal challenges, reduce design risk, and produce reliable, high-quality devices that satisfy changing market demands. In today’s competitive landscape, adopting thermal analysis as a core component of the design process is not only advantageous, but necessary for success.

Working with Faceted Geometry in Ansys Fluent Meshing

Faceted geometry comes in several different formats with OBJ, PLY, and STL being commonly used.  Some simulation tools require solid geometry before importing.  Fortunately, Fluent Meshing is designed to work with surface models. These faceted file formats are often the standard when working with 3D scanned geometry in the medical community and in the field of additive manufacturing. Faceted geometry approximates a geometric shape by representing it as a triangular surface mesh rather than using a solid body representation. Many commercial CAD and CAE packages do not natively represent geometry using facets but use a technique called Constructive Solid Geometry (CSG) to represent geometry which is the process of combining simple shapes using Boolean operations to create more complex shapes. One of the issues when working with faceted geometry is CSG-based CAD and CAE programs are not well equipped to convert the surface mesh associated with faceted geometry into a solid, and it can be a time-consuming process to do so.

Fluent Meshing (a feature in Ansys CFD licenses) can work directly with faceted or solid geometry. The user will need to use Ansys Discovery to convert the faceted geometry file (OBJ, PLY, STL, etc.) into a TFG (Fluent-Meshing faceted geometry) before reading into Fluent Meshing. See below:

All the named selections and geometry preparation that was done on the faceted geometry in Ansys Discovery will be preserved in Fluent Meshing when reading in the TGF. The user can then use some of the mesh diagnostic tools in the Outline View to evaluate the quality and check for connectivity issues if needed. There are automatic operations that can be used to improve the quality of the mesh as required. See below:

The user can generate the volume mesh in the Outline View or use one of the more user-friendly task-based workflows such as Fluent Watertight Workflow. The task-based workflows do not yet support TGF geometry import, so the user will need to write out a .msh.h5 in Fluent Meshing before reading into the workflow. See below:

It is business as usual with the faceted geometry loaded into the import geometry task of the workflow. The user will start from the top and work their way down in the task-based workflow until a volume mesh is generated.

Some engineering tools require that geometry be represented as a solid, and it can be challenging to convert faceted geometry into a solid in many cases. Fluent Meshing is designed to work with surface models so faceted geometry does not need to be converted into solid before import. This can be a quality-of-life improvement when working with surface representations of solid bodies in Ansys CFD products.

Automation in Ansys EnSight

Computational Engineering International, Inc. (CEI) originally developed a suite of products that included EnSight and was acquired by Ansys in 2017. EnSight is a market leading post-processor for Computational Fluid Dynamics (CFD) with multiphysics visualization capabilities. It is easy to use with a modern interface that has transient capabilities and can efficiently handle very large data sets, which are common in CFD simulations, especially transient ones.

EnSight has continued to improve their Python integration over the years and continues to lead in automation capabilities for the world of CFD post processing. Any action that takes place in EnSight is recorded in what is referred to as the command language. Whether the action is a zoom, translate, or rotate of the camera, or the creation of post processing objects like a clip plane, vector arrow plot, or contour – the action is saved in the command language. See below Command Panel:

The command language is a comprehensive journaling language in EnSight that contains all the detailed information associated with the operations or actions taken place in the current session. This command language can be converted into a Python script which can be executed using the built-in interpreter. The user will copy the commands to be converted into Python and paste them into a new file.

The actions are more human-readable in Python and allow for logic operations and loops. The user can make changes to the Python script as appropriate and save for use in other EnSight sessions to automate processes, which can be a huge time saver in certain situations. For example, if you need to create several post processing objects in EnSight for a variety of result files for use in a report, you will only need to do it once because you can reuse the commands for all results files.

Check out this YouTube video on automating the creation images of post-processing objects in EnSight using Python.

Utilizing the built-in Python interpreter in EnSight is a great way to automate repetitious post-processing procedures.

Troubleshooting Unphysical Solution Results and Identifying Poor Mesh Elements

Not if, but when you run into CFD convergence issues, it is often due to a poor-quality mesh, an ill-posed problem, or inappropriate solver settings. There are a variety clues that indicate lack of solution convergence such as high residuals, solution monitors that do not make sense, and mass or energy imbalance. When residuals are high or increasing (diverging) it is a good indication that there is unphysical behavior in the solution that is the cause. You will need to identify where this unphysical behavior is occurring in the model so that it can be remedied.

Often reporting minimum and maximum values of the solution variables (velocity, pressure, temperature, etc.) is a good place to start when attempting to identify unphysical behavior. For example, if the maximum flow speed is measuring much higher than you’re expecting, you will want to identify where in the domain this unexpected behavior is occurring. An iso-surface is a good tool to use for identifying the location of odd behavior in the solution field.

You can compute the range of a particular solution variable in the iso-surface panel. If the range is not what you expect or does not make physical sense, it is a good idea to create an iso-surface to identify where the potential unphysical behavior is occurring. You can use the iso-surface in concert with other mesh objects in a scene and take a look at where the unexpected behavior is occurring:


In this example the location of high flow speed appears to be unphysical. You will want to interrogate the mesh in that particular region to look for clues – this can be done in the solver or mesher. Everyone is in a hurry to get results and it can be tempting to move forward with a poor-quality mesh in the solver, but you run an increased risk of solution convergence issues in the solver when doing so. It is best to start with a good quality mesh to accelerate solution convergence. Meshing is somewhere between an art and a science, but there are four primary mesh metrics that are used in concert when judging overall mesh quality – orthogonal quality, skewness, aspect ratio, and size change. To avoid mesh-related convergence issues, it is best to keep the minimum orthogonal quality above 0.1, skewness below 0.95, aspect ratio below 100, and size changes below 5.

To inspect the mesh quality inside of Ansys Fluent meshing, open the Display Grid panel from the menu bar, select the specific mesh quality metric to measure, then choose the quality range before hitting the display button. The elements within the specified range will be displayed in the graphics window as shown below:

To inspect the mesh quality in the Ansys Workbench mesher you will display the mesh histogram from within the mesh tab then choose the mesh metric to measure as shown in the figure below.

You can limit the range of the histogram to only contain the poorest quality elements by clicking the control button to access the range controls. From here you can limit the range of the x-axis then hit the reset button adjust the y-axis range. You may also want to consider reducing the number of bars in the histogram as well. Click the bars of the histogram to display the elements of that quality indicated: