Troubleshooting Common Ansys Mechanical Errors: Solutions for DOF Limit, Unconverged Solutions, and Element Distortion

When solving complex models in Ansys Mechanical, several common errors may arise. In this blog, we’ll explore three frequent error scenarios—DOF limit exceeded, unconverged solutions, and element formulation errors—and provide solutions for each.

Error Scenario 1: DOF Limit Exceeded

This error indicates that at least one body in the model has reached a degree of freedom (DOF) limit, often due to rigid body motion (RBM). Mechanical will prompt you to check for insufficient constraints. This situation is typically a result of rigid body motion (RBM), and Mechanical will have a message suggesting the user search for insufficient constraints.

In a static analysis, every part in the model must be constrained so it cannot freely rotate or translate. RBM is a consequence of one or more parts being insufficiently constrained. Check that there are enough external constraints on the model (i.e. supports) to prevent RBM. Here’s how to resolve this:

  • Ensure that all parts are constrained or connected to supported parts.
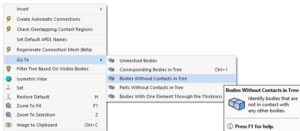
  • Be attached to supported parts using contacts, joints, or other connections. Mechanical offers a right-click menu in the graphics area with an option that can identify missing connections (below).


If you are depending on nonlinear contacts (Frictionless/Frictional/Rough) to hold the model together, make sure they are initially closed. The Contact Tool is a great help for this. Be aware that nonlinear contacts will not prevent separation, and they may not prevent sliding either.

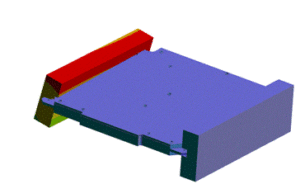
If you are not able to identify any parts that are underconstrained, try running a Modal analysis with the same supports as your static analysis. The animated deformation plots from the Modal analysis should help you identify what parts need constraints. Pay special attention to modes at 0 Hz or very close to it. The mode animation below shows one part moving without deforming the rest of the assembly, indicating that it is underconstrained. Be aware, however, that Modal analysis forces nonlinear contacts to become linear, so it may not identify all problems with nonlinear contacts.


Error Scenario 2: Unconverged Solution

In this scenario, you may see the line “Reason for Termination … Unconverged Solution” in the solution information, and there will be an Error message in Mechanical that reads, “The solver engine was unable to converge on a solution for the nonlinear problem as constrained.”

This error occurs for nonlinear models. When a model is nonlinear, the solution affects the model’s stiffness, and the solver needs to iterate on a solution until the remaining error is within tolerance. There are three main factors that can cause a model to be nonlinear: material properties like plasticity, nonlinear contact types, and the Large Deflection option under Analysis Settings. One or more of these nonlinearities is responsible for the failure to converge. You will need to identify which nonlinearities are the cause.


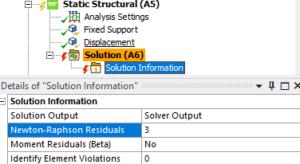
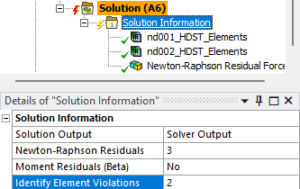
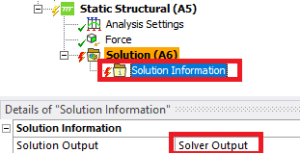
The most helpful tool for troubleshooting a force convergence error is Mechanical’s Newton-Raphson Residuals. In the Details of Solution Information, set this to some non-zero value (2 or 3 is usually enough). The plots will only be created if a non-zero value was set before the analysis was solved. You may need to initiate the solve and let it fail again in order to get the Newton-Raphson plots. Adjusting the time steps to ensure it fails quickly is recommended. Before re-attempting the solve, you may wish to try the other troubleshooting steps in this section.


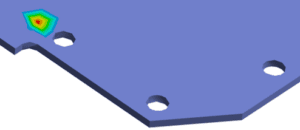
The Newton-Raphson Residual plots will show hotspots (red color) where the residuals are highest. This means you should look for conditions that are scoped to these elements. Often you will see high residuals on elements that are participating in a nonlinear contact region. If so, this contact region needs attention.


Possible solutions to a contact region with high Newton-Raphson Residuals include:

  • Mesh refinement on the faces scoped in the contact region.
  • Reducing normal stiffness of the contact region to a Factor of 0.1 or 0.01.
  • Using a linear contact instead of a nonlinear one if acceptable.
  • Using displacement-based loading rather than force-based loading to close a contact region that is initially open.

Aside from the Newton-Raphson Residual plots, there are a few other tools that can help narrow down the reason for non-convergence. Per the last section, make sure the model is fully constrained and rigid body motion is not possible. If any substeps have solved, create True Scale deformation plots for the solved time points and look for any unexpected behavior such as large deformations or assemblies separating. Plots of plastic strain can identify regions that are collapsing due to widespread yielding.

If you’ve reviewed the Newton-Raphson Residual plots and solved timesteps but it still is not clear what is causing the analysis to fail, a useful approach is to remove all nonlinearities from the model and make sure it solves. If it does, then add nonlinearities back into the model gradually. When you reintroduce a source of nonlinearity and the solve fails again, you can be confident that this nonlinearity is what needs attention before the solve can succeed.

Error Scenario 3: Element Formulation Errors

This reason for termination is often accompanied by the error message in Mechanical: “Element N Located in Body (and maybe other elements) Has Become Highly Distorted.” The element formulation error means that certain elements fail to meet criteria that are required to obtain a meaningful solution. Most often the elements have become so distorted that the analysis cannot continue. An ideal element is a cubic hexahedron or a tetrahedron with four equal sides. When elements have high aspect ratios, have highly skewed shapes, or even begin to turn inside out, they are liable to terminate the solver with this error.

The first step is to identify the elements that have the error. Look at the error messages in Mechanical and the Solution Information worksheet for specific element numbers. Then find where these elements are located in the mesh (this video shows how; use the element option instead of the node option).

There is also an option to create Named Selections for element violations under Solution Information. Set this to a non-zero value (2 is usually fine).


Using either the Named Selections or the Select Mesh by ID tool, observe the element shapes and locations. If they are highly skewed, it may help to improve the mesh in that area to get better quality elements.

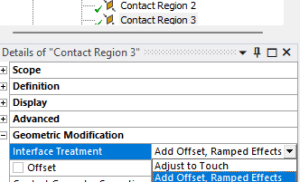
Another important step is to find out how far the solver made it before the failure occurred, as described earlier. If no substeps solved, then there was a problem applying the initial conditions. Use the Contact Tool to identify contacts that have initial penetration. If you have any nonlinear contacts with initial penetration, use the Add Offset, Ramped Effects setting for those contacts, or Adjust to Touch if you wish to ignore the penetration. Elements in contact regions can easily get distorted when the penetration is removed with the No Ramping setting.


If you do have solved substeps, use the plots of the solved substeps along with the locations of the element violations. (Note again that results set to Display Time = Last are unconverged and are not meaningful.) Are these elements starting to distort just before the failed time step? Is there a lot of plasticity on these elements? If the elements are actually becoming distorted, you may need to improve the mesh to get better initial quality. In scenarios with a lot of plasticity, you may not need to solve the whole analysis if the solved time steps already show levels of plasticity that indicate failure of the product.

Sometimes the elements do not seem to be visibly distorting in the solved time steps. In that case, they may be distorting due to a load being applied too suddenly or due to insufficient constraints. Think about whether there are new loads being applied in the time step that failed, or whether there are parts about to come into contact. Consider ramping loads more slowly or using displacements rather than forces to move parts into contact.

Nonlinear modeling in FEA is a deep subject, and not every scenario or possible solution is covered here. Even so, we hope this guide will provide a starting point that will help you solve complex models in Ansys Mechanical.

Understanding error messages is crucial, but to prevent them, identifying them is key. Don’t miss our blog on how to use Ansys Mechanical’s troubleshooting tools to resolve failed solves and produce accurate results. 


How to Troubleshoot Failed Solves in Ansys Mechanical: A Step-by-Step Guide

When you initiate a solve in Ansys Mechanical, the program attempts to find a solution based on the boundary conditions you’ve specified. However, not all problems will solve on the first attempt. This guide will show you how to use Ansys Mechanical’s troubleshooting tools to resolve failed solves and produce accurate results. 

How to Identify a Failed Solve

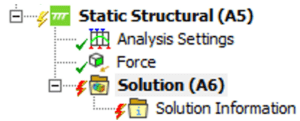
A failed solve is indicated by a red lightning bolt next to the solution. When this happens, Ansys generates error messages that explain what went wrong.


By clicking the Messages button, you can view a list of these messages categorized as Info, Warning, or Error. Warning messages should be read and understood, but they do not always indicate a problem. Error messages are generated when solving (or another action) fails to complete, and these messages explain what happened. You will need to address the cause of the error message before proceeding. Later in this article, we will recommend troubleshooting steps for the most common errors.


  • Warnings: Indicate potential issues but may not affect the solve.
  • Errors: Must be addressed as they prevent the solve from completing.

Using the Solution Information Worksheet

To further troubleshoot, search the Solution Information worksheet for terms like “error” or “reason for termination.” These messages provide specific details on why the solve failed. Understanding when the failure occurred (e.g., which load steps were completed) is also crucial for narrowing down the issue.


Use CTRL+F to search for “error” and read any error messages you find here. Sometimes there will be more detailed messages here. The last error message is usually the ultimate reason the solve failed.


Also search for the phrase “reason for termination.” If present, this line indicates exactly why the solve failed. Recommendations for interpreting some of the common reasons for termination are described later in this article.


Next, figure out when the solve failure occurred. It is important to know what load steps, if any, were completed before the solve terminated because that will narrow down the cause. For instance, if no time points were solved, the problem may be that the model is initially underconstrained. If the solve completed two load steps and failed on the third, you should look at any changes to the boundary conditions in the third load step.

Select Solution and view the Tabular Data as shown below. This shows that two substeps were solved, and the last successful step was t = 0.45s. The third row that shows Substep = 1e+006 represents the unconverged results and does not mean that t = 1s solved successfully. It can be very informative to create result plots set to the last converged substeps (t = 0.45s in the example below). The results at unconverged substeps are not physically meaningful and should generally not be used.


Once you understand the error that terminated the solve and the load step when the solve terminated, you can take corrective action to make the solve successful. The next steps will depend on the error encountered. For detailed advice, see DRD’s blog on troubleshooting steps based on the most common error messages.


Troubleshooting Tips 

  • Check constraints: Ensure all parts are sufficiently constrained to prevent rigid body motion (RBM).
  • Review boundary conditions: If the solve failed after completing a load step, inspect changes in boundary conditions.
  • Create result plots: Use the last converged substep to identify potential issues. Unconverged substep results are not physically meaningful and should generally be ignored.

Want to dig deeper into advanced troubleshooting? Our blog on using Ansys Mechanical diagnostic tools covers additional tips to help you streamline your solving process

What Does the Contact Tool Provide in Ansys Mechanical?

If you use Ansys Mechanical for simulation, you probably use its contact modeling features. And if you use contacts in Mechanical, you’ll be more efficient if you use the Contact Tool to validate your setup and generate useful results. This tool gives you fast insight into how your contacts are behaving, even before the analysis has started. Whether you have just set up your contacts and want to know if they are working correctly, or you are troubleshooting an analysis that failed to solve, or you want detailed results for a contact region, the Contact Tool is the way to go.

How Can You Save Time by Running the Ansys Mechanical Contact Tool Before Structural Analysis?

When simulating a structural assembly, it is often most efficient to run the Contact Tool before running the analysis itself. The Contact Tool runs in a fraction of the time required for the full structural analysis, and it warns you about any contact regions that are not working correctly. All you need to do is add a Contact Tool under the Connections branch and generate initial contact results. Then you’ll see a table that looks like this:

The color of these rows is based on the Status column and the type of contact region. Here’s how to interpret the different row colors:

  • White (Closed) contact regions are closed and working normally.
  • Gray (Inactive) regions are duplicate contacts created by the solver when using default contact behaviors. You can ignore these.
  • Red (Far Open) regions are linear contacts (Bonded or No Separation) that are not working correctly. You should check each of these contact regions and make changes to them if you want them to be included in the analysis.
  • Yellow (Near Open or Far Open) regions are nonlinear contacts (Frictional, Frictionless, or Rough) that are initially open. This may be acceptable but you should be aware that these regions will not hold the model together as long as they remain open.
  • Orange (Closed) regions are working correctly but there may be a large gap or initial penetration. It is recommended to check these regions carefully if they were generated automatically, since they may be connecting two parts that are not connected in real life.

If you see any contacts that you are concerned about, you can right-click on any of these rows to go to the corresponding region in the tree and make changes to the contact settings. It is much easier to identify and fix these problems now than to wait for the analysis to solve then try to figure out why the results don’t seem right.

It is also possible to make plots of contact status, gap, or penetration. Make use of these plots if you want to quickly visualize what areas are in contact or how large the gaps in the contact regions are.

How Can You Use the Ansys Mechanical Contact Tool to Troubleshoot Problems After Solving a Model?

Sometimes an analysis solves partially but does not complete, or it solves all the way and the results do not look correct. Either way, you can use a solution Contact Tool to figure out whether the solution problems are related to contact behavior. Hopefully you’ve verified that the initial contact status is realistic (see preceding section). You can also add a Contact Tool under the Solution branch and use it to observe how the contact status changes during the simulation.

This tool is mainly useful for troubleshooting if the model has nonlinear contacts (Frictional, Frictionless, Rough). Make a note of what time in the simulation convergence difficulties started to happen or other unwanted behavior started to occur, and see if there are any changes in contact status around that time. For instance, if two parts start in contact and then separate, that may be a source of instability in the model. Similarly, if two parts are initially separate and the simulation runs into problems after they collide, then this contact region is probably the source of the convergence difficulty.


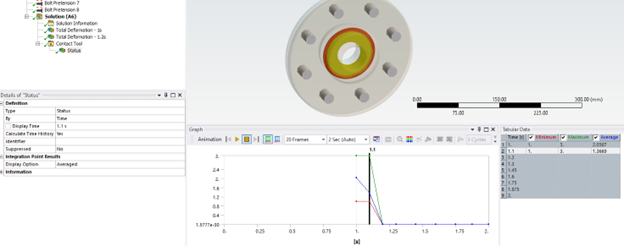
Plots of contact status are color-coded so you can visualize which regions are closed (orange and dark orange) and which are open (blue or yellow depending on gap size). These statuses also have corresponding integer values for the purposes of graphs and probes:

  • 0: Far Open
  • 1: Near Open
  • 2: Closed (Sliding)
  • 3: Closed (Sticking) 

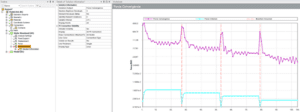
Using this knowledge, the graph below shows that the contact is sticking (3) at time = 1s, then suddenly switches to Far Open (0) at 1.2s. If a sudden status change like this occurs, you should verify that the model behaves correctly after the change.

How Can You Use the Ansys Mechanical Contact Tool for Postprocessing Results?

Even once you’ve validated the setup for the model and run the analysis successfully, the Contact Tool still has more to offer. You may be able to use deformation plots to view the general behavior of parts in contact, but sometimes more detailed information is needed. For instance, in sealing applications it is very important to ensure there are no gaps in the seal during operating conditions. The status plot below shows that the yellow region (open contact) is probably too large to guarantee an adequate seal.

Other results, such as contact pressure or penetration, are also available. If these quantities are relevant to the performance of your design, then be sure to make use of these results.

Explore our library of Ansys Mechanical resources, including tutorials, case studies, and best practices. Start exploring now!