If you use Ansys Mechanical for simulation, you probably use its contact modeling features. And if you use contacts in Mechanical, you’ll be more efficient if you use the Contact Tool to validate your setup and generate useful results. This tool gives you fast insight into how your contacts are behaving, even before the analysis has started. Whether you have just set up your contacts and want to know if they are working correctly, or you are troubleshooting an analysis that failed to solve, or you want detailed results for a contact region, the Contact Tool is the way to go.
How Can You Save Time by Running the Ansys Mechanical Contact Tool Before Structural Analysis?
When simulating a structural assembly, it is often most efficient to run the Contact Tool before running the analysis itself. The Contact Tool runs in a fraction of the time required for the full structural analysis, and it warns you about any contact regions that are not working correctly. All you need to do is add a Contact Tool under the Connections branch and generate initial contact results. Then you’ll see a table that looks like this:

The color of these rows is based on the Status column and the type of contact region. Here’s how to interpret the different row colors:
- White (Closed) contact regions are closed and working normally.
- Gray (Inactive) regions are duplicate contacts created by the solver when using default contact behaviors. You can ignore these.
- Red (Far Open) regions are linear contacts (Bonded or No Separation) that are not working correctly. You should check each of these contact regions and make changes to them if you want them to be included in the analysis.
- Yellow (Near Open or Far Open) regions are nonlinear contacts (Frictional, Frictionless, or Rough) that are initially open. This may be acceptable but you should be aware that these regions will not hold the model together as long as they remain open.
- Orange (Closed) regions are working correctly but there may be a large gap or initial penetration. It is recommended to check these regions carefully if they were generated automatically, since they may be connecting two parts that are not connected in real life.
If you see any contacts that you are concerned about, you can right-click on any of these rows to go to the corresponding region in the tree and make changes to the contact settings. It is much easier to identify and fix these problems now than to wait for the analysis to solve then try to figure out why the results don’t seem right.
It is also possible to make plots of contact status, gap, or penetration. Make use of these plots if you want to quickly visualize what areas are in contact or how large the gaps in the contact regions are.
How Can You Use the Ansys Mechanical Contact Tool to Troubleshoot Problems After Solving a Model?
Sometimes an analysis solves partially but does not complete, or it solves all the way and the results do not look correct. Either way, you can use a solution Contact Tool to figure out whether the solution problems are related to contact behavior. Hopefully you’ve verified that the initial contact status is realistic (see preceding section). You can also add a Contact Tool under the Solution branch and use it to observe how the contact status changes during the simulation.
This tool is mainly useful for troubleshooting if the model has nonlinear contacts (Frictional, Frictionless, Rough). Make a note of what time in the simulation convergence difficulties started to happen or other unwanted behavior started to occur, and see if there are any changes in contact status around that time. For instance, if two parts start in contact and then separate, that may be a source of instability in the model. Similarly, if two parts are initially separate and the simulation runs into problems after they collide, then this contact region is probably the source of the convergence difficulty.

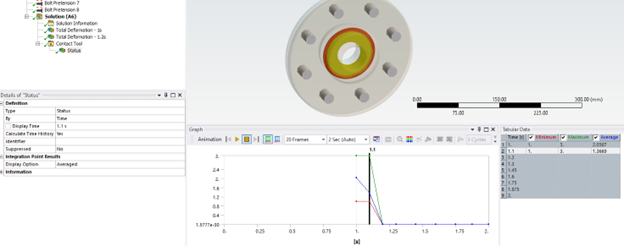
Plots of contact status are color-coded so you can visualize which regions are closed (orange and dark orange) and which are open (blue or yellow depending on gap size). These statuses also have corresponding integer values for the purposes of graphs and probes:
- 0: Far Open
- 1: Near Open
- 2: Closed (Sliding)
- 3: Closed (Sticking)
Using this knowledge, the graph below shows that the contact is sticking (3) at time = 1s, then suddenly switches to Far Open (0) at 1.2s. If a sudden status change like this occurs, you should verify that the model behaves correctly after the change.

How Can You Use the Ansys Mechanical Contact Tool for Postprocessing Results?
Even once you’ve validated the setup for the model and run the analysis successfully, the Contact Tool still has more to offer. You may be able to use deformation plots to view the general behavior of parts in contact, but sometimes more detailed information is needed. For instance, in sealing applications it is very important to ensure there are no gaps in the seal during operating conditions. The status plot below shows that the yellow region (open contact) is probably too large to guarantee an adequate seal.

Other results, such as contact pressure or penetration, are also available. If these quantities are relevant to the performance of your design, then be sure to make use of these results.

Explore our library of Ansys Mechanical resources, including tutorials, case studies, and best practices. Start exploring now!

